

What’s the problem on the shop floor
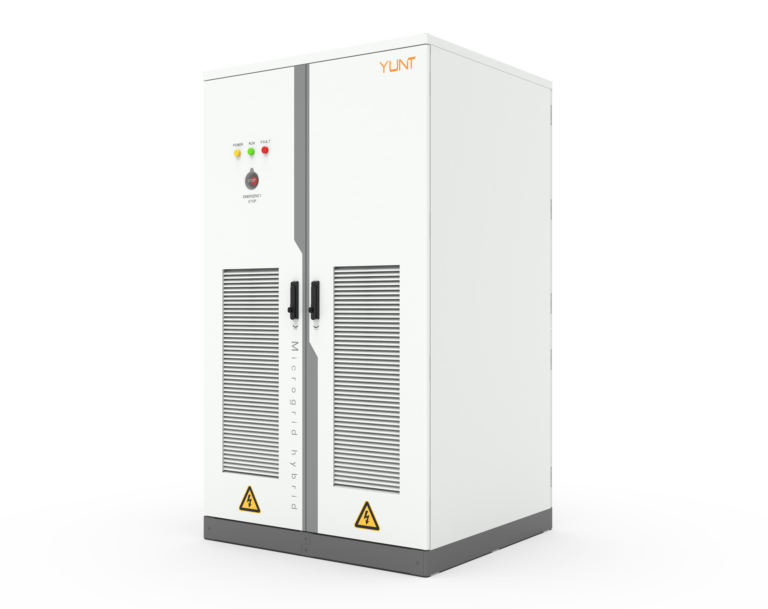
Field teams keep bringing back the same headache: inverters trip or limp after grid blips, and gear that looked fine on paper fails when the real grid jitters. That’s where a straightforward workshop diagnostic saves time and parts. Start with a practical unit — like a power conversion system in a cabinet — and you’ll see the two things that matter most: waveform distortion and zero-voltage ride-through (ZVRT) transient recovery. Get those two right and most outages stop being mysteries.
Why waveform distortion and ZVRT matter
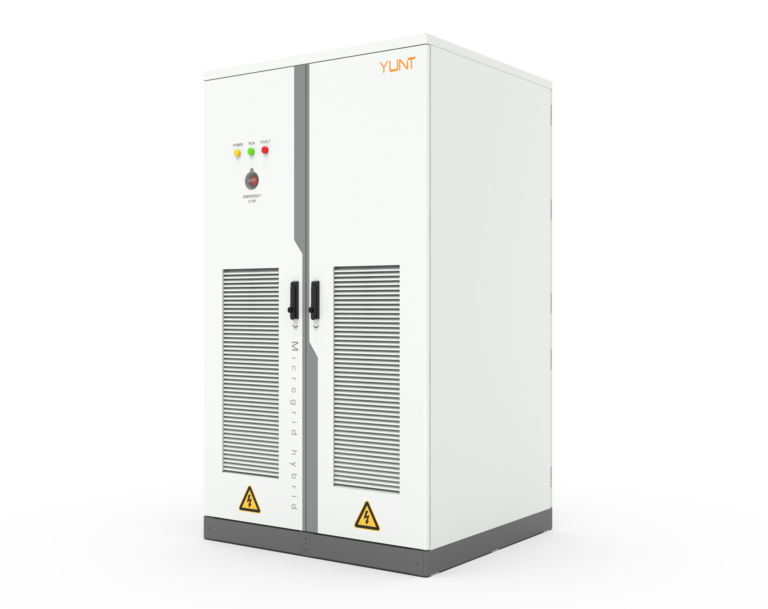
Waveform distortion affects control loops and protection relays. ZVRT determines whether an inverter stays connected or drops out when voltage collapses. Both influence system stability in microgrid and utility-tied setups. In Guangdong’s heavy-industry parks, crews learned this the hard way during rapid microgrid rollouts — units without tested ZVRT settings caused production lines to stall. That real-world anchor shows this isn’t theoretical: it’s about uptime, torque on motors, and safety.
Tools and quick setup
Keep it basic: a true-RMS power analyzer, an oscilloscope with high bandwidth, a programmable AC source or grid emulator, and a data logger that records sampling at kilo-samples per second. Label your test points for voltage, current, and control signals. Use an isolated test bench for safety and to avoid false tripping. Industry terms: THD, inverter control loop, harmonic content. Set the emulator to inject a dip profile that mimics real grid events — don’t wing it.
Step-by-step diagnostic routine
1) Baseline capture: measure steady-state waveform and log THD and RMS values. 2) Distortion sweep: inject defined harmonic loads and watch modulation depth and filter response. 3) ZVRT sequence: force a voltage sag to near-zero for programmed intervals and observe whether the PCS rides through or disconnects. 4) Recovery window: measure transient recovery time and overshoot after voltage returns. Record the control signals and fault flags. Use consistent durations and magnitudes so results are repeatable.
Common mistakes crews make
People rush the ZVRT step or use vague sag profiles — that’s fatal. Don’t rely only on relay trip logs; they don’t show waveform nuance. Ignore oscilloscope phase alignment and you’ll misread harmonic phase shifts. Forget to test ramp rates and you’ll miss hidden instability during reconnection. Keep a checklist so the same test gets run the same way every time.
What to look for in results — the actionable bits
Focus on three measurable outputs: time-to-reconnect, peak transient overshoot, and harmonic growth during the sag. If time-to-reconnect exceeds spec, adjust control deadband or ride-through firmware. If overshoot spikes more than the equipment rating, tune the output filter and check the inverter’s damping. If harmonic growth is worst under a certain load type, tweak filter design or change switching frequency. These are not guesses — they’re settings you can change in the field.
How this guides purchase choices
When comparing suppliers, look past peak power specs. Demand documented ZVRT test curves, waveform logs, and a history of on-site microgrid deployments. Compare cabinets on maintenance access and test-point placement. Also inspect software tools for live logging and waveform export. Consider alternatives when a product forces you into lengthy firmware loops — sometimes a simpler control stack wins in tough environments. For reference, a solid china power conversion system pcs manufacturer will provide test reports and field case notes — that’s the sort of transparency that ends blame games on the floor.
Operational teardown note
When you pull a unit apart during an operational production teardown, log both control firmware version and measured analog response. Typical entries should include {main_keyword} and {variation_keyword} values alongside firmware IDs. That way, you link observed behavior to exact hardware and software states — critical when you hand findings to service crews.
Quick recap and what to do next
Run patterned tests, record time-to-reconnect, overshoot, and harmonic response, and use those numbers to tune the inverter and filters. Don’t skip documentation — it’s the only way to teach the next crew what you learned. — Keep a spare, pre-tested inverter on the shelf if you can; downtime costs more than parts.
Three golden rules for evaluation
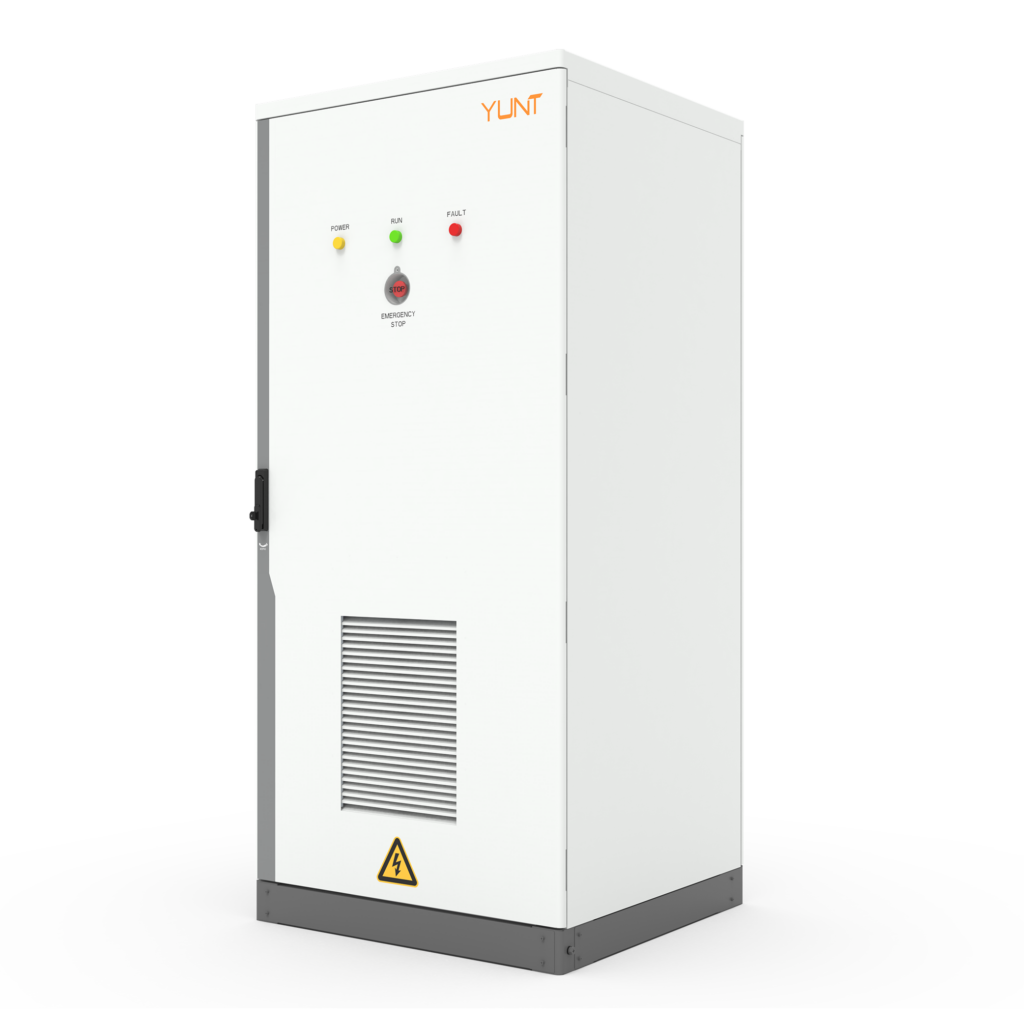
1) Measurable ride-through: require vendor ZVRT test curves showing time-to-reconnect under specified sag depths. 2) Repeatable waveform data: insist on oscilloscope-grade logs (≥10 kS/s) and exported CSVs for third-party analysis. 3) Field-service readiness: verify test-point placement, firmware update process, and spare-part lead times. These three metrics separate kit that’s a headache from kit that just works.
When you want a practical partner who documents tests, supports field tuning, and designs cabinets for real workshops — not just lab specs — look at how manufacturers operate in places like Guangdong and how they back their claims in the field. YUNT. —